Attendance for an after-school program
An attendance platform for an after-school program. Staff check students in on their phones, admins watch every site live, and there's a district dashboard. A real client launched it, used it daily, and I handed it off.
- Role
- Sole developer, discovery through training
- When
- December 2025 to August 2026
- Built with
- Next.js, TypeScript, Firebase
- Scale
- 12 schools, about 500 students
Try it
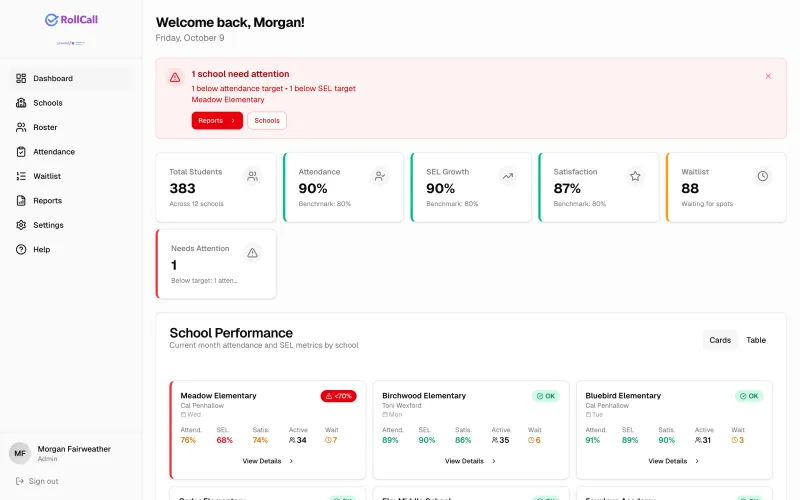
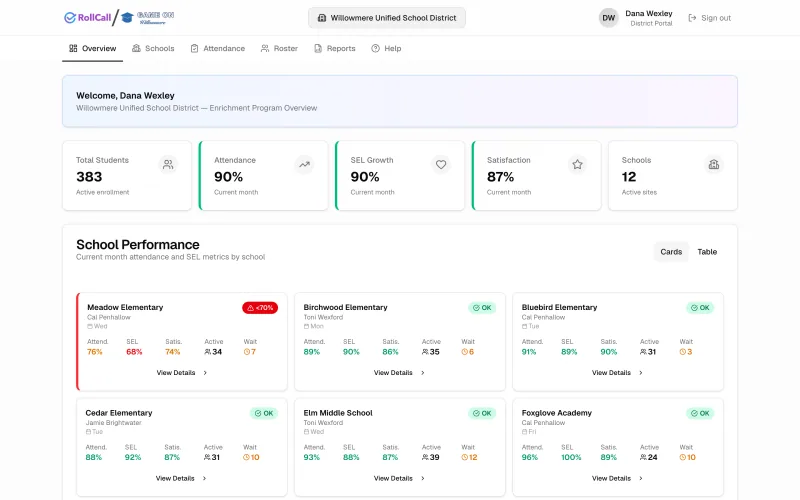
School Performance
Current month attendance by school
Made-up schools and a made-up month.
How it works
Details
Before it was an app
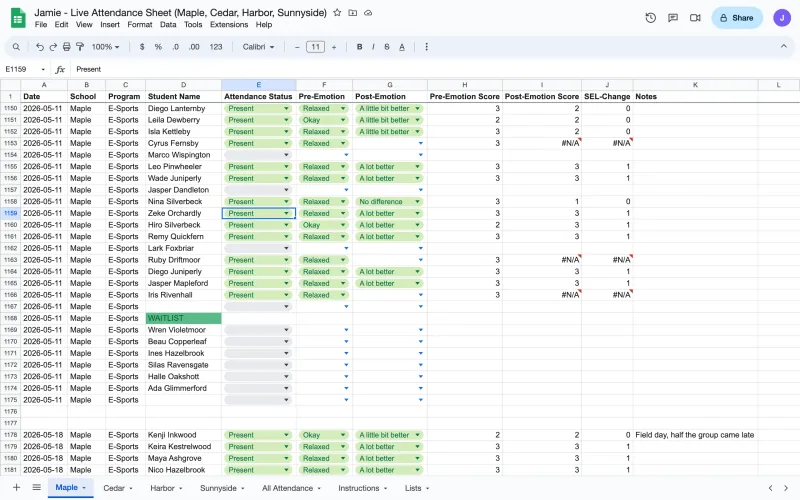
Three instructors each kept a spreadsheet, with one tab per school. Those fed one master workbook. Someone still had to merge them by hand, so nobody had a current picture. The season's sheets ran to about 12,000 rows, one per student per session, from November to June.
Phones, then the office
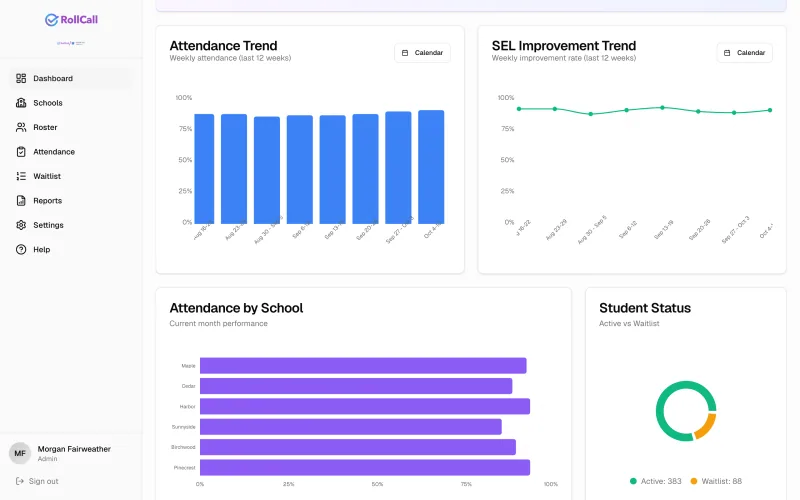
Instructors mark each student present, absent, or at another program, and they log a quick check-in on how the student is feeling. Admins see attendance by site, plus rosters and waitlists, as those saves come in. The app builds the monthly PDF and emails it, instead of someone assembling a spreadsheet. A separate read-only district dashboard sits beside that. I cleaned the old sheets and imported about 5,500 attendance and check-in records, so the views started with history.
The rate was lying
The overall rate was an average of each school's rate. A 10-student site counted the same as a 60-student one, so one small site's bad week could move the whole number. It also counted days when a school's program doesn't meet, which dragged every rate down. I raised it with the client myself, then changed the math. The overall number now adds up real attendance and divides once. Every metric, report, and alert counts only the days that program actually runs.
Launch and handoff
The first full version, district dashboard included, came together in 23 days. The client tested it for several weeks and asked for additions. I trained the instructors on site, and it went live at all 12 schools in March 2026. In August I handed over the code and the Firebase project. Their team has kept building on it since.
Want to build together?
I'm looking for a full-time team doing AI automation and agentic engineering. Email is the fastest way to reach me.